4 years ago
According to some sources, over 40% of all Internet traffic is made up of bot traffic. And we know that malicious bots are a significant proportion of current bot traffic. This article describes a number of strategies (Machine Learning, user authentication using simple input devices, and behavioral biometrics) which you can use to distinguish automatically between humans using the Internet (on the one hand), and bots (on the other hand).
Theory
Inputs from multi-factor authentication
These days, it is very common to authenticate a user by using a form of multi-factor authentication. Remember that multi-factor authentication verifies against at least two of the following:
- something that only this user has access to, for example, a security card, or a USB stick, etc.
- something that only this user knows, which is usually a password
- something that proves where the user is at a given moment in time, for example, additional confirmation is required when the user withdraws money from an ATM which this user does not normally use
- something that is a part of only this user, for example, the user's fingerprint, the user's eye irides, the user's voice, or a behavioral pattern followed by the user
In this article, we will focus on the last point in the list above. Can we recognize and make use of behavioral patterns that apply to human users (but not to bots), and without needing to create the sophisticated data set required by tools such as fingerprint readers? Yes, we can! It turns out that we only need to track particular forms of usage of a mouse, a keyboard, or a mobile screen.
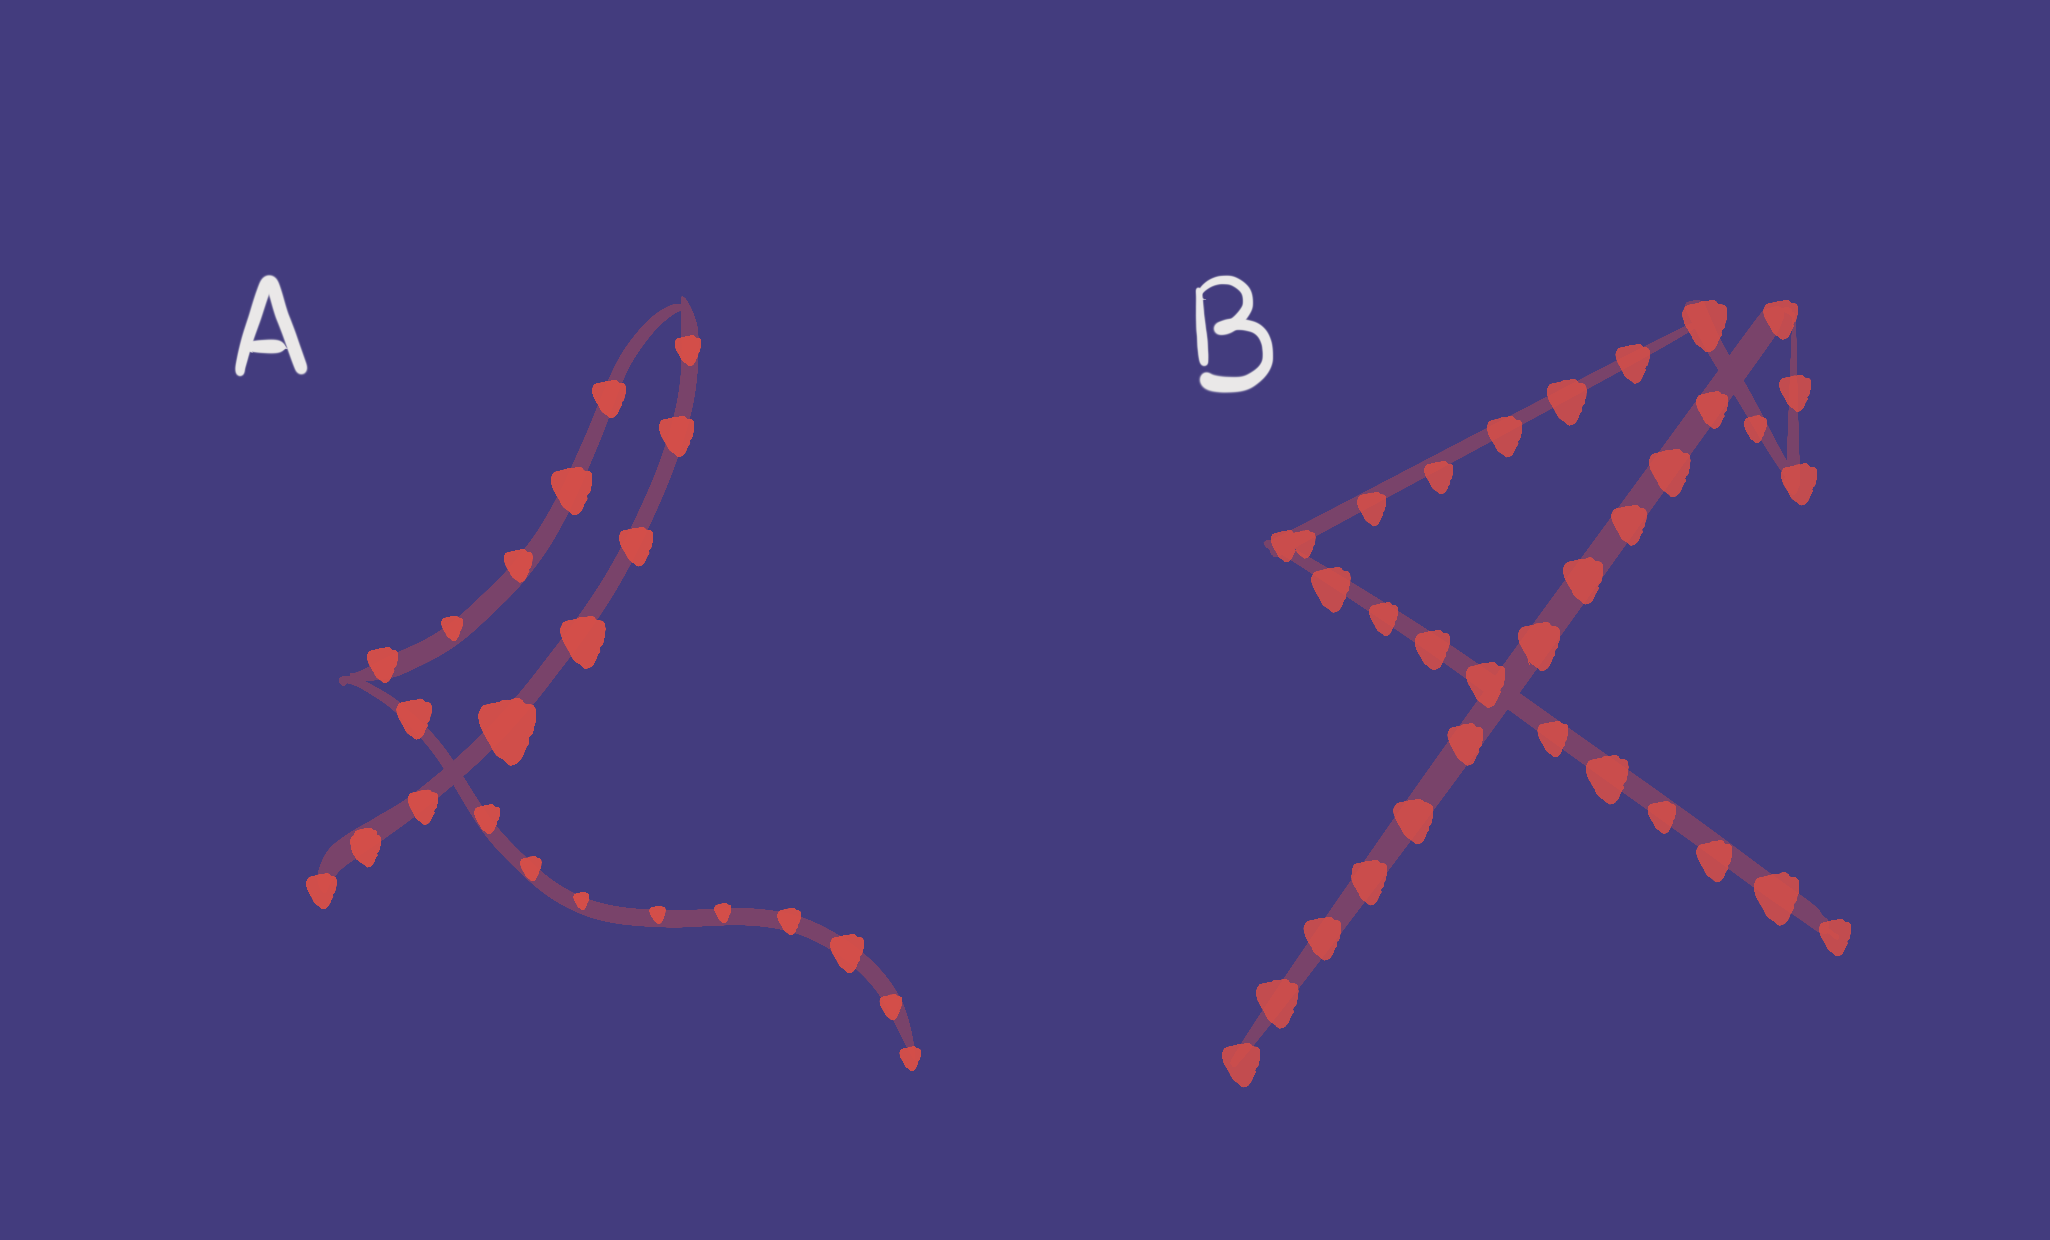
First, let's analyze cursor movements. Which features of cursor movements make it possible for us to tell if the "user" is a human, or is a bot?
Are the mouse movements curved, or straight?
Mouse trajectories are completely different for humans, and for bots. Bots can often move the mouse in the most “effective” way, that is, by avoiding any unnecessary turns or curves. It is almost impossible for humans to move a mouse around in the same "direct" fashion. You can see this clearly in the visualization below:
Cursor velocity
According to many studies, the range in the velocity of the cursor movements made by humans falls within common probability distributions. Usually, cursor velocity for humans will fall within the log-normal distribution, as shown below:
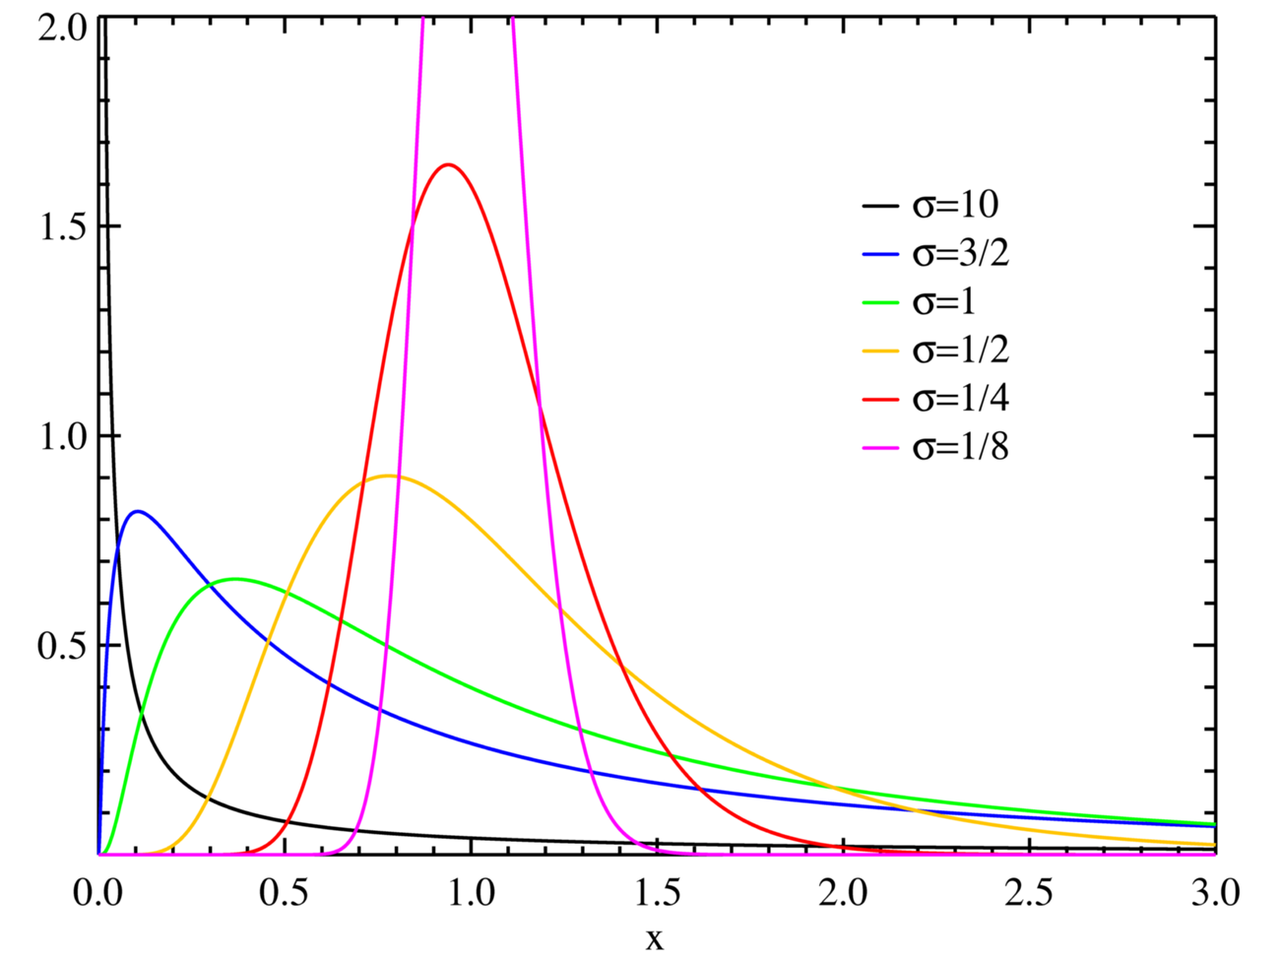
Source: https://en.wikipedia.org/wiki/Log-normal_distribution
But the velocity of a cursor which is being controlled by a bot does not usually match the above standard distribution. As a result, a bot is likely to fail this test.
Length of direct movements (number of mouse movements)
Another simple, but surprisingly effective, metric is to check how many movements a user makes in order to move to a certain button. A bot is usually programmed to get to new coordinates by “jumping” directly to those coordinates from the current coordinates, but a human needs a larger number of shorter, less direct mouse displacements, in order to move to the new coordinates from current coordinates.
In other words, the combination of human hands/brain moves a mouse around in a zig-zag fashion, one small step at a time, gradually getting nearer to the new location. On the other hand, a bot tends to go directly to the new location, and in far fewer displacements, which means that tracking such movements is perfect for detecting bots.

For this detection-case, the math is even simpler than in the cases described above: we simply calculate the number of mouse-move events divided by time. Alternatively, we can also consider calculating the distribution of the lengths of those movements as a metric.
How about metrics from the keyboard?
Yes, it's a good question. Tracking keystroke dynamics also works well. In this case, we capture data about how quickly a user completes authentication by typing keys on the keyboard.
Analyzing the rhythm and speed of typing
When analyzing key-stroke dynamics we can look at outputs such as:
- the length of time a key is pressed down (duration)
- the length of time between pressing, first, one key, and then pressing the next key (the "interarrival" time)
So, as a human being, how do you do your typing? For sure: the interarrival time varies, depending on the keys you press; the duration of pressing a key also probably varies; and there are times when you do no typing at all ("freeze up") for some reason, perhaps to think about what you're going to type next. That's how humans function! But bots make key-strokes in a way which is more or less continuous, and with few, if any, variations. By analyzing the degrees of variance, and certain patterns of behavior, we can decide whether the user is a human, or a bot.
Errare humanum es
Last, but not least, we can analyze the process by which the user creates content by typing. A high number of typos and/or corrections is a strong hint that the user is a human being. In this case, we can analyze some simple frequency statistics in our bot-detection model.
Building the bot-detection model
There are two good approaches to creating our bot-detection model. We'll choose the first approach if we already have a labeled set of data that the model can learn from. On the other hand, if we don't already have a labeled set of data (or if we’re not confident about the quality of our labels, or if we suspect that the behavior of the bots has been updated since the time when the labels were added), we'd go for the second approach, which is based on unsupervised learning.
Yes, we have labeled data
Sorry, but building a neural network is overkill in this case. Let's go for the simplest possible algorithm, which, as you know, is Logistic Regression! We use Logistic Regression (LR) for problems in which we need to classify something into one of two possible groups. To be more precise, in this case, we use LR to assess the likelihood that a user belongs to either class 0 (a human), or class 1 (a bot).
The assessment mechanism is quite simple: we give weights to each of the parameters that are input to the model. For example, the more mouse displacements take place, the less likely it is that the user is a bot. So the number of mouse displacements multiplied by the given weight for that factor should impact the final decision, and make it more likely that the user is classified as a human. On the other hand, the quicker the keystroke movements are, the more probable it is that we are dealing with a robot. Therefore, the given weight for this factor should impact the final decision, and make it more likely that the user is classified as a bot. For each feature we are tracking, we multiply the results by the relevant weight. And then we add those weighted values together. Now we can decide whether or not the final score (y in the graph below) is high enough to assign the user under test to class 1 (a bot).
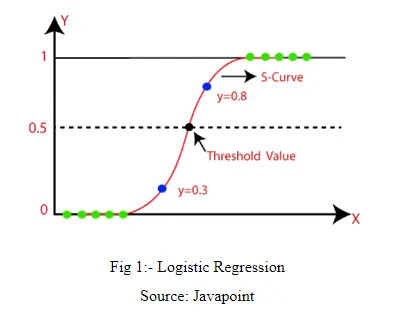
Source: https://www.excelr.com/blog/data-science/regression/understanding-logistic-regression-using-r
As usual in probability problems, the expected score falls somewhere between 0 and 1. So, we could say that all users with scores where y is below 0.5 are considered to be in class 0 (a human), and all users with scores where y is equal to, or exceeds, 0.5 are considered to be in class 1 (a bot). But it's up to you to define the threshold in the way that best suits your needs. If you want to be super cautious, and spot even the slightest signs that a user might be a bot (at the expense of risking more false alarms), you can choose to reduce the threshold from 0.5 to, for example, 0.3.
But we don't have any (reliable) labeled data
To cut a long story short, we suggest that you give unsupervised learning a try.
That's because:
- if you follow the first approach described above, any incorrectly labeled cases might mislead the model, and it is more and more difficult to keep cases correctly labeled, when the bots themselves are becoming more and more sophisticated
- although bots are gaining more human-like properties, the distributions and ratios between the numbers behind their behaviour might show suspicious accuracy and coherence. In other words, even though, at first glance, the pattern of a bot's behaviors might look quite natural, when patterns are visualized by AI, those behaviours might indicate too little variation (such as discrete variable values, instead of continuous variable values), and so such behavior looks like it was designed beforehand, and is repeated in different variants.
Which is the best algorithm?
In the first place, we suggest going for an algorithm that implements a simple clustering method (such as k-means clustering). Just as with the Logistic Regression algorithm we described above, in the beginning, the simpler the algorithm, the better.
We also recommend using a tool called Principal Component Analysis (PCA) at an early stage in your analysis of data for the above experiments. PCA processes a large quantity of data (a large number of dimensions), and outputs the essence of those dimensions, but only in, say, 2 dimensions, which is something that you can then review on a 2D plot. In this way, you can more easily spot any differences in behavior, which helps you to decide which feature, or features, you would first like to focus on tracking. For more information on PCA, please see: Principal component analysis - Wikipedia. In the future, we're planning on publishing a more complete article about using PCA, so keep an eye out for that.